minute read

The COVID-19 pandemic is an unprecedented crisis and one that will financially impact most utility organizations. Raleigh Water recognized early that because of the various emergency orders issued by the Governor of the State of North Carolina and the Wake County Board of Commissioners related to the COVID-19 pandemic, there would potentially be significant and immediate changes to how customers used water.The utility anticipated that mandatory business closures would cause a reduction in water sales that would be offset by an increase in residential water sales due to the stay-at-home orders.
The City’s residential water rate structure is an inclining block with three tiers. Tier 1 covers usage up to 4 ccf. Tier 2 includes usage from 4 ccf to 10 ccf, and Tier 3 includes usage above 10 ccf. The City of Raleigh decided to enact an ordinance to provide relief from the financial burden of higher water bills resulting from increased residential usage during the current state of emergency. The ordinance increased the Tier 2 threshold from 10 ccf to 20 ccf, with Tier 3 capturing all usage above 20 ccf. This change went into effect April 16.
Raleigh Water needed to quickly evaluate and understand the financial implications of the ordinance change to the utility’s revenues.
To monitor and try to anticipate reduced revenues from changing tier thresholds, as well as anticipated reduced usage and other expected reduced revenues, Raleigh Water reached out to Raftelis to build a COVID-19 Sensitivity Dashboard. The dashboard is built into the utility’s existing financial planning model to provide on-demand monitoring of the effects of potentially rapidly changing variables. The variables identified by Raleigh Water staff include the following:
Shown below are dashparts from Raleigh's COVID-19 Sensitivity Dashboard.
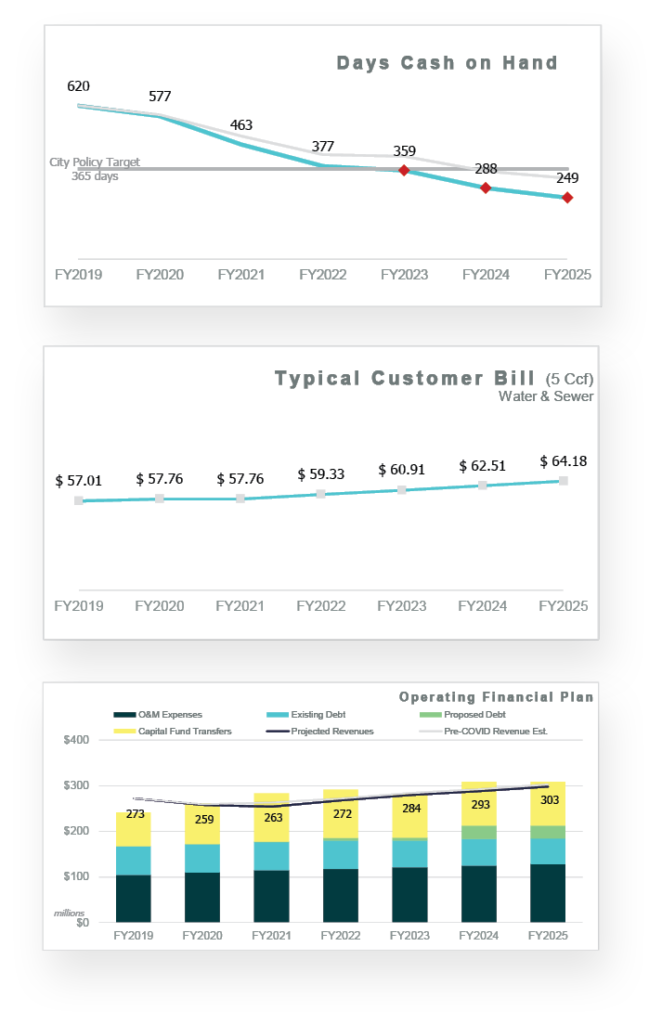
Unlike the standard dashboards that are built into many financial models, the COVID-19 Sensitivity Dashboard was designed to allow for the manipulation of variables that do not typically change significantly from year to year and allows for these variables to be changed more frequently. Levers for each variable are built directly onto the dashboard, which allows for immediate results showing the effects each of these variables will have on revenues and key metrics. The controls on the dashboard also allow for quarterly and semi-annual adjustments to reflect changing expectations for the duration of the crisis and recovery period. Information is presented both numerically and visually through a series of graphs including the following:
By adding the ability to conduct an unlimited number of scenarios using the revised financial planning tool, Raleigh Water is able to immediately understand the financial impacts of not only the ordinance changes enacted by the City Council, but also longer term impacts resulting from changes in customer demand that occurs throughout the crisis.
To learn more, see how we helped Fairfax County with their financial stress testing, view our insight on stress testing your financial plan, or explore how Raftelis can help you with financial stress testing.
Link copied