minute read


Authors: Rocky Craley, Senior Manager (Email) and Arisha Ashraf, Consultant (Email)
Raftelis’ biennial survey of water and wastewater rates includes utilities of all sizes from across the U.S. We encourage you to review the survey, which is published by the American Water Works Association, as it’s a snapshot of key financial metrics in the water and wastewater sector. We use the survey data to look for trends in our industry, and here we have focused on analyzing capital costs for water and wastewater service by region.
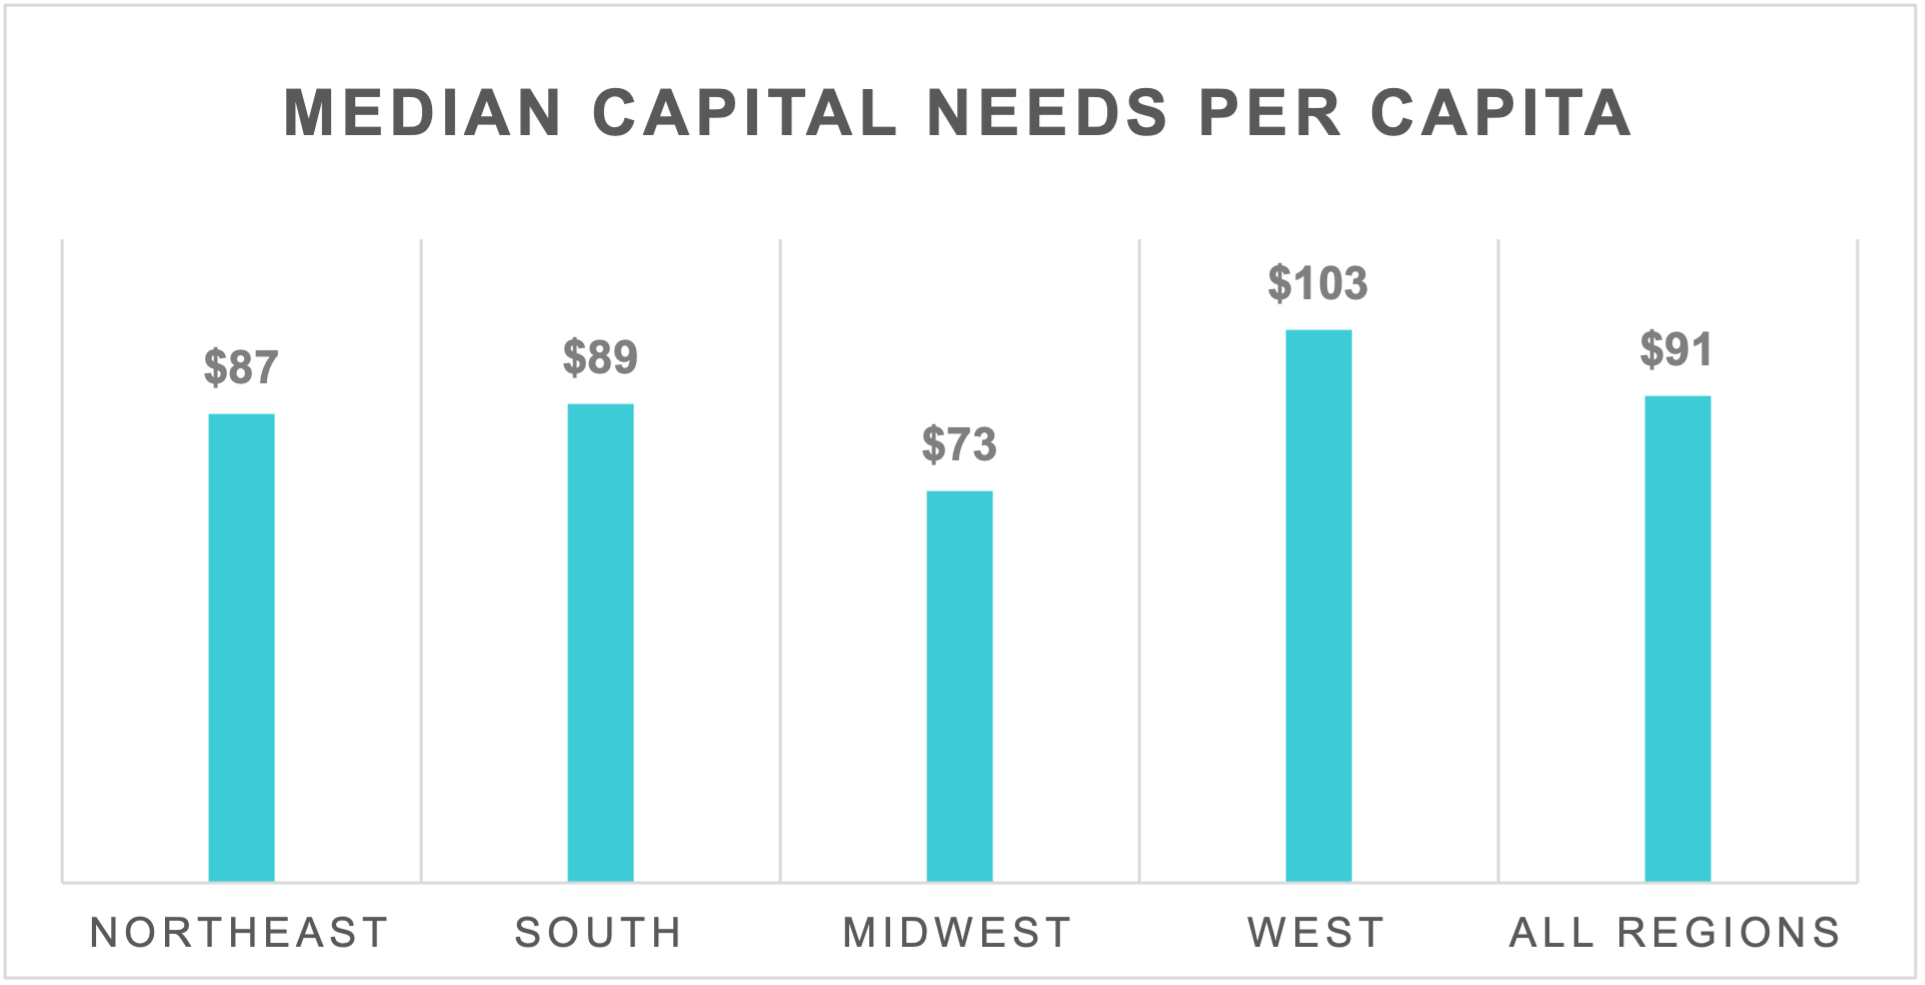
Although the need for capital investment varies significantly from one utility to the next depending on size, location, geography, density, and other influences, we took the data related to capital needs and evaluated it on a per capita or per million gallons sold basis. By normalizing the data in this way, we can compare capital cost per region. Western utilities show the highest capital needs by far with the Midwest showing the lowest needs on a per capita basis.
The Midwest may have the lowest median capital needs per capita because it is relatively flat terrain. Utilities do not need to contend with the rockier ground of the Northeast or the mountainous terrain of the West. Additionally, the Midwest requires less built-in resiliency in their systems when compared to utilities on the West Coast with seismic issues and utilities in the South with hurricane issues.
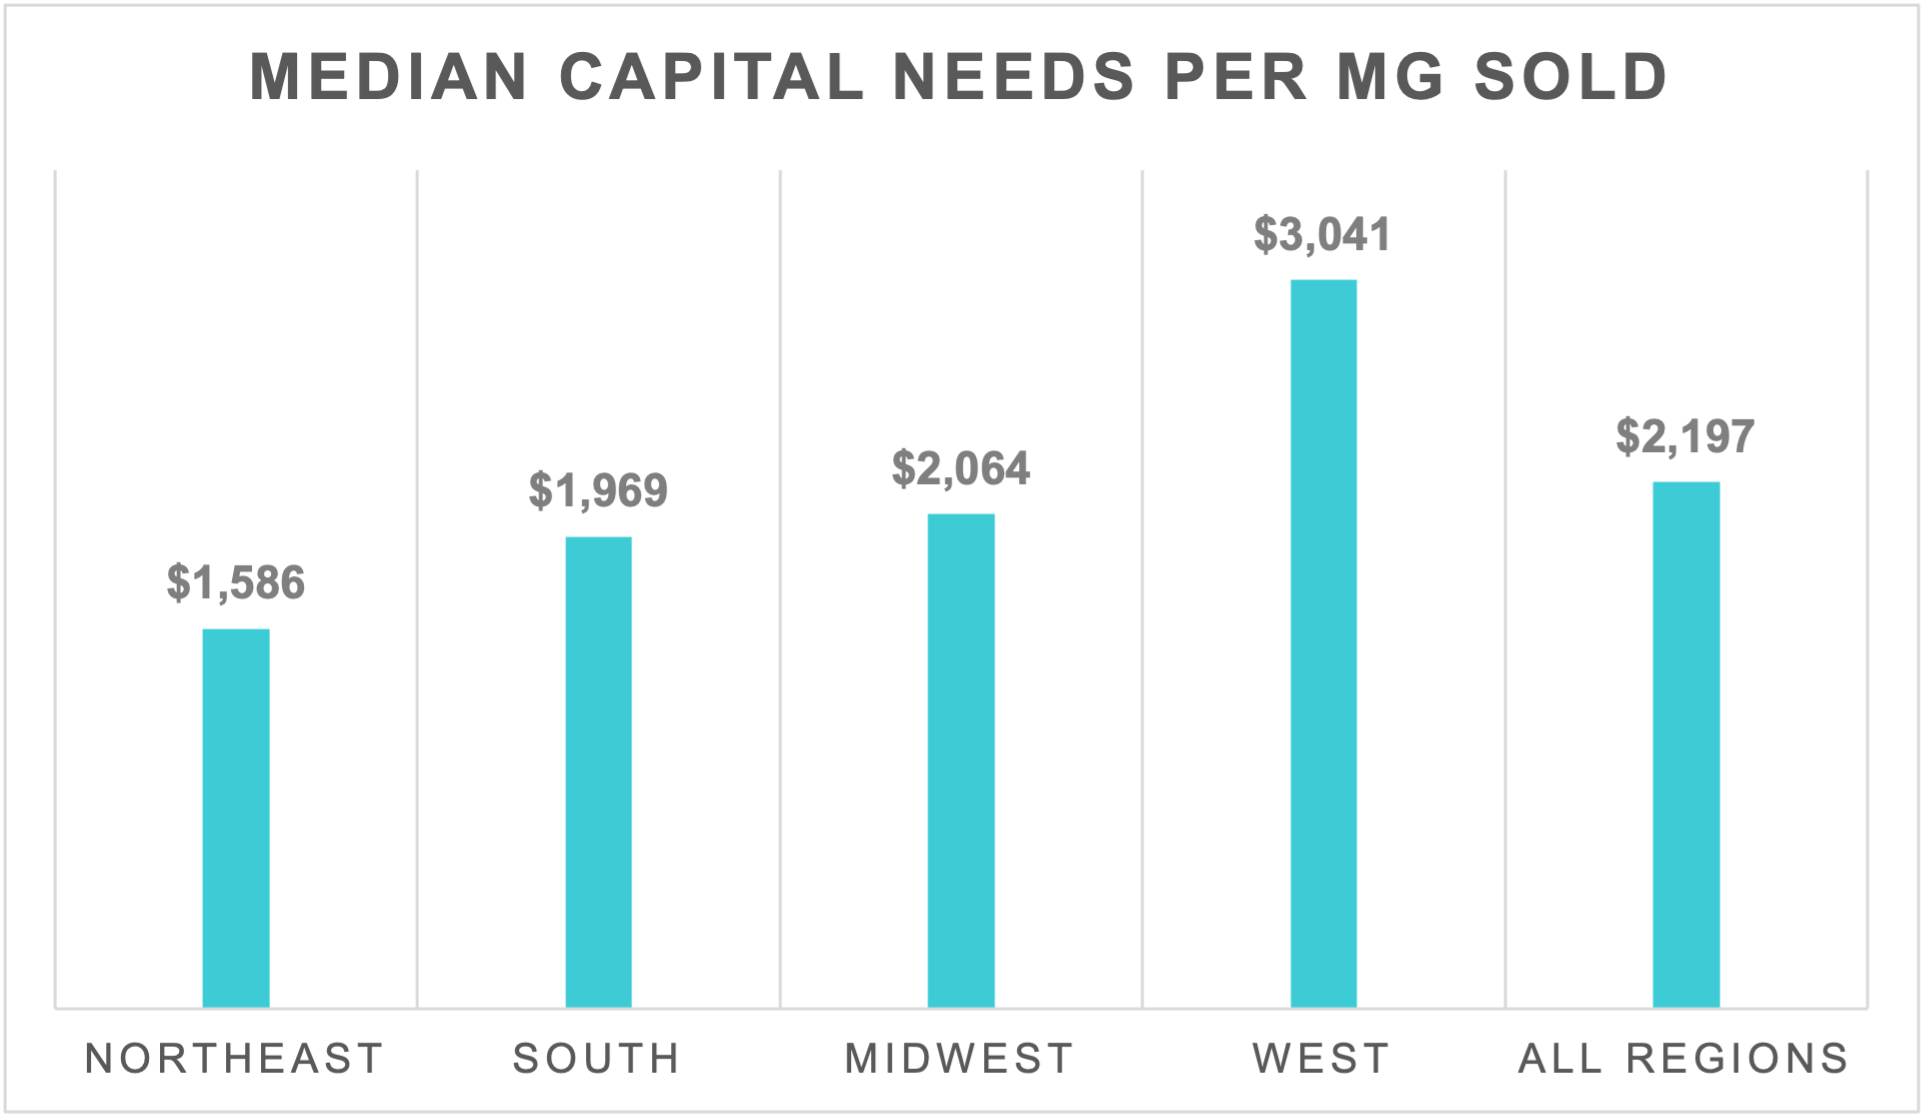
The Northeast may have the lowest median capital needs per million gallons sold because the Northeast produces and sells a lot of water. In fact, many utilities incentivize the use of water. The Northeast is the region with the highest percentage of decreasing block rate structures, a rate structure that charges customers a lower rate for higher volumes of water use. This may be the driver for the lower capital needs per million gallons sold.
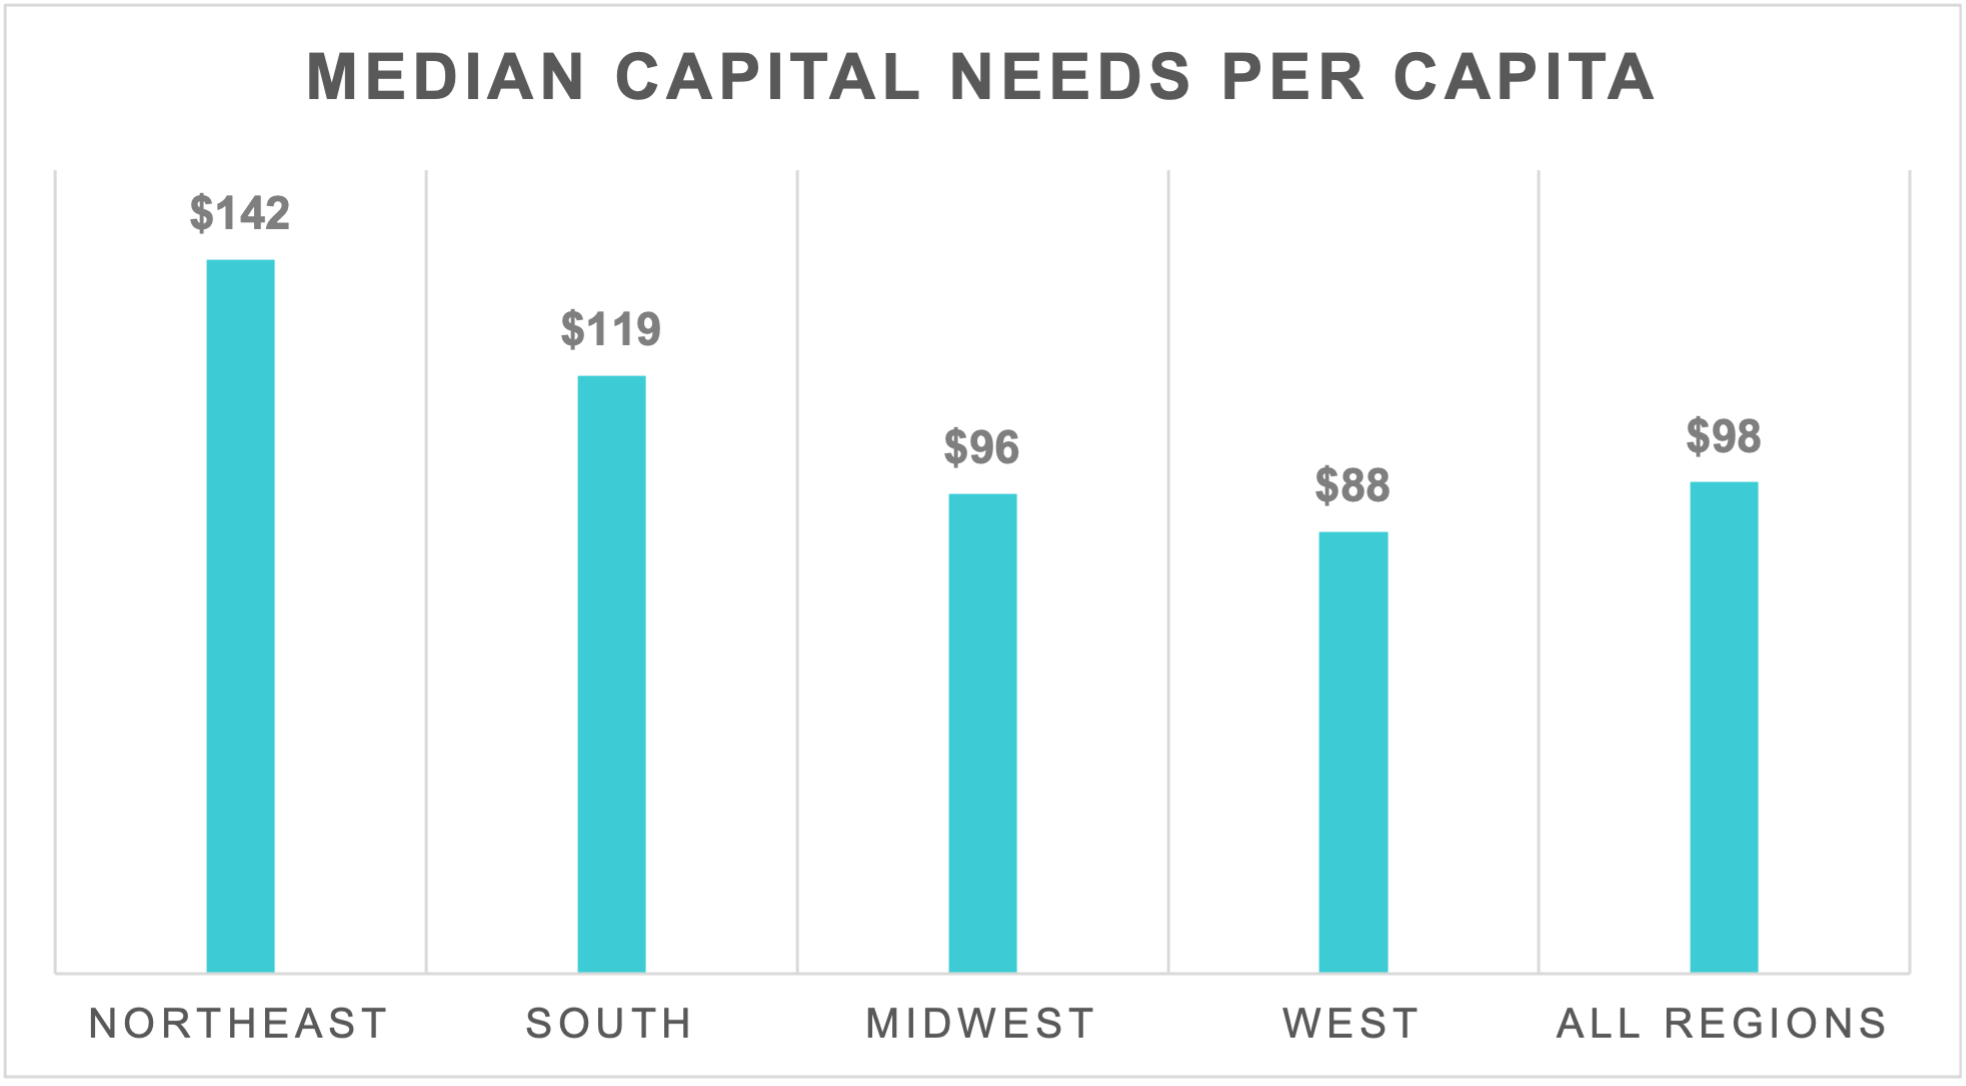
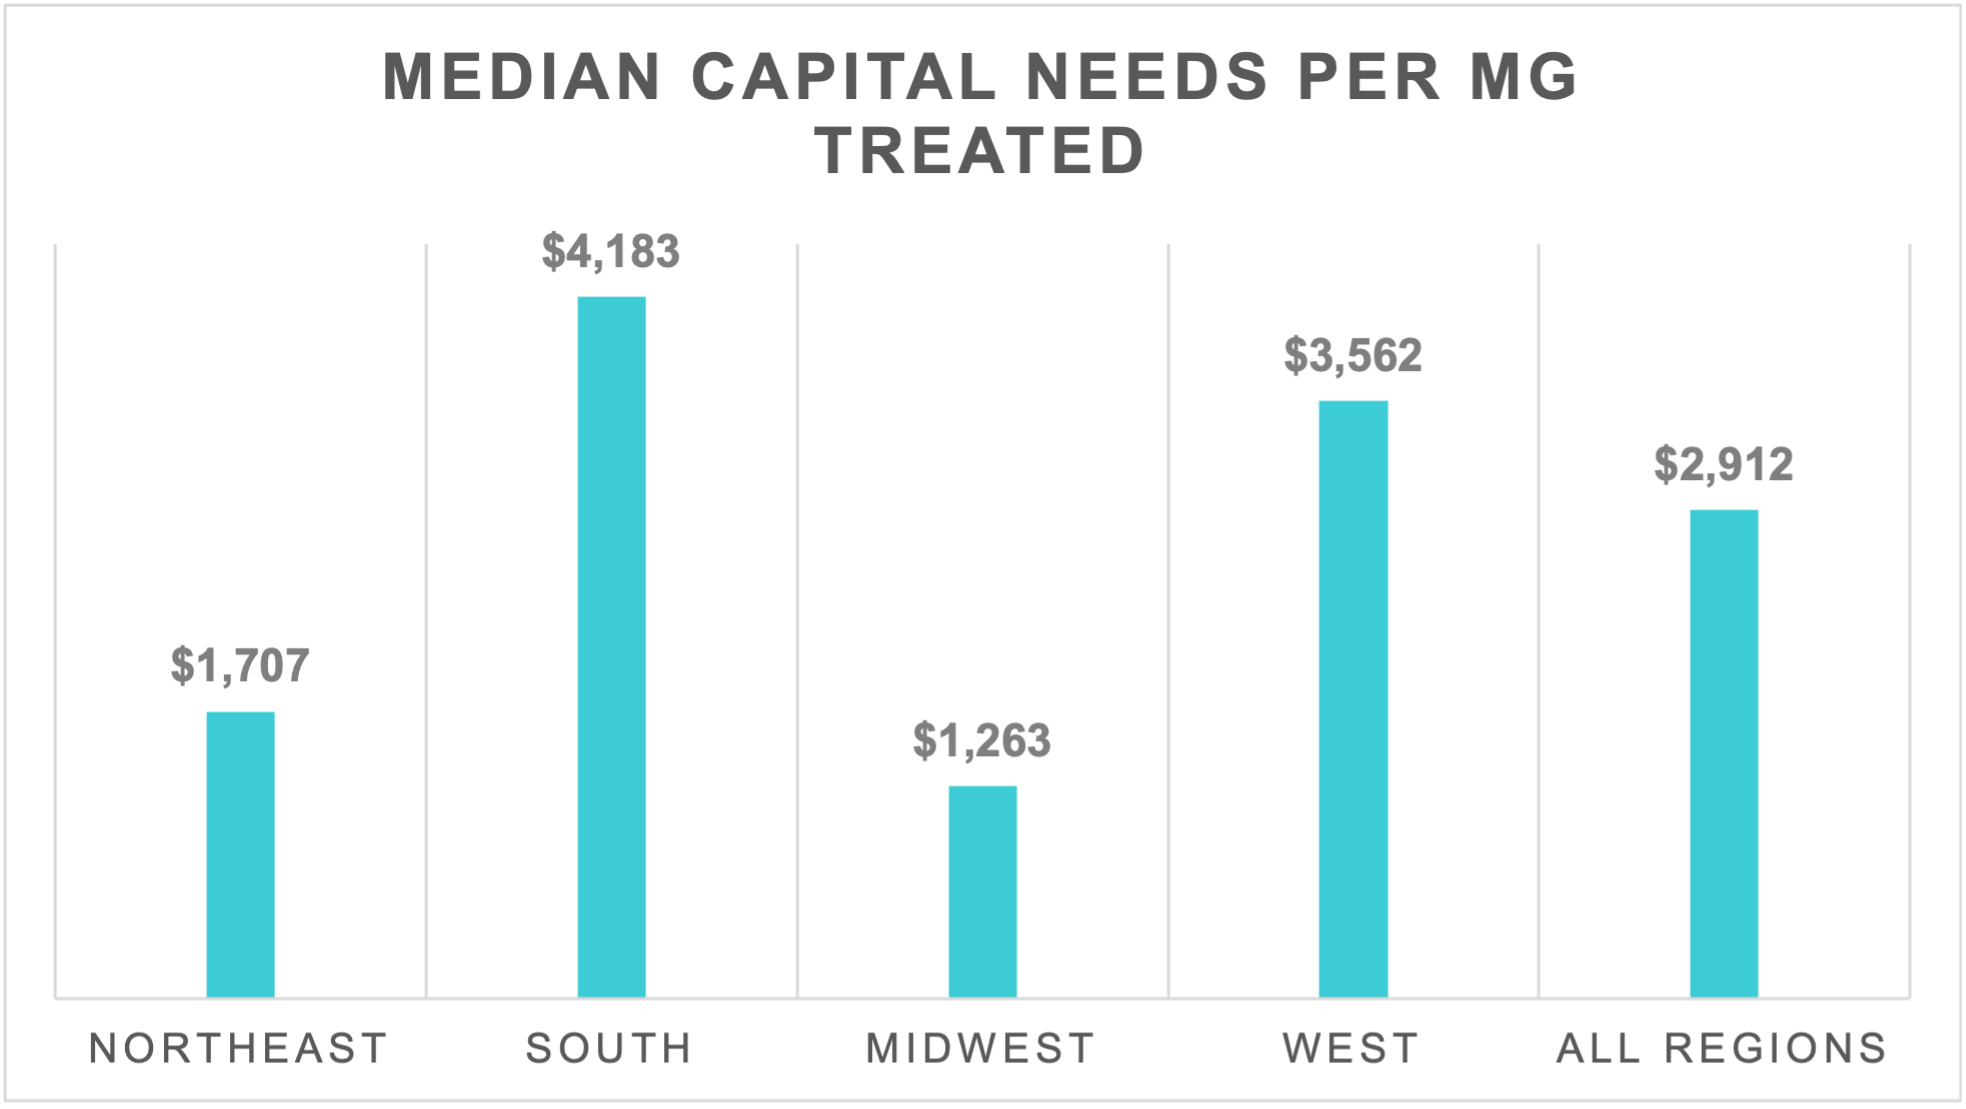
On the other side of the water equation, median capital needs per capita and per million gallons treated look different than for water capital costs. Unlike the water analysis, the West does not show the highest value for either comparison. The Northeast has the highest median capital needs per capita, and the South is the region with the highest median capital needs per million gallons treated.
The results may be driven more by the denominator (i.e., per capita or per million gallons treated) than the value of capital needs. For example, the Northeast may be the highest for median capital needs per capita because the region’s population is steady or declining in many areas as people move to the South or West. The South and West are the regions with the highest median capital needs per million gallons treated, which may be because utilities in the Midwest, and especially the Northeast have combined or partially combined wastewater and stormwater systems. That means a significant amount of inflow, or stormwater, is being treated at the plant. In the West and South, systems tend to be separated, and the amount of effluent treated is much lower because it only represents metered water flow returned to the wastewater system, with only minimal amount of inflow and infiltration.
Link copied