 Email)">
 Email)">
As consultants, clients regularly request that we perform “benchmarking” as part of our work. They are eager to know how their operations compare against peer agencies or how their performance stacks up against the industry. For example, organizations want to know what the “right” number of staff should be for a public works department or a water treatment plant’s operations. While benchmarking helps to tell a story and provide valuable quantitative metrics, its use can be a blunt instrument unless its points are sharpened with the context in which operations occur. For this reason, we always couple any benchmarking exercise with a review of the organization’s operations. While the client may first approach us with the intention of obtaining quantitative metrics as the benchmarking deliverable, we know that the true value of benchmarking lies in understanding the “why” of a metric as opposed to the “how much.”
Benchmarking is the practice of comparing an agency or department against similar regional or national peers. For industry-wide comparisons, it is common for professional associations to report various performance metrics. For example, AWWA conducts a benchmarking survey that provides water and wastewater utilities an understanding of how they compare to national trends. In our work assisting local governments and utilities, we use industry data in addition to data gained from local and regional peer organizations. Key to the benchmarking effort, however, is tailoring the metrics and peers to the client’s needs. While some metrics are nearly universal, others may not be applicable to a client or may need to be adapted to meet their needs. For example, a wastewater utility that provides conveyance and treatment services may wish to be benchmarked. At first glance, a nearby city’s wastewater utility appears to be an ideal peer based on size and proximity, but this potential peer only provides wastewater conveyance services. Either this peer should be excluded from the benchmarking effort, or any metrics obtained from this peer should relate only to aspects of wastewater conveyance. Combined water-wastewater utilities that share staff and resources between their services often also require a custom approach. Knowing when and how to allocate resources and staff between the services and when to develop metrics for the combined utility can provide more accurate and insightful benchmarking than can be achieved by simply copying the metrics found in an industry survey.
Below is a sample of one benchmarking comparison for a utility (with agency names removed):
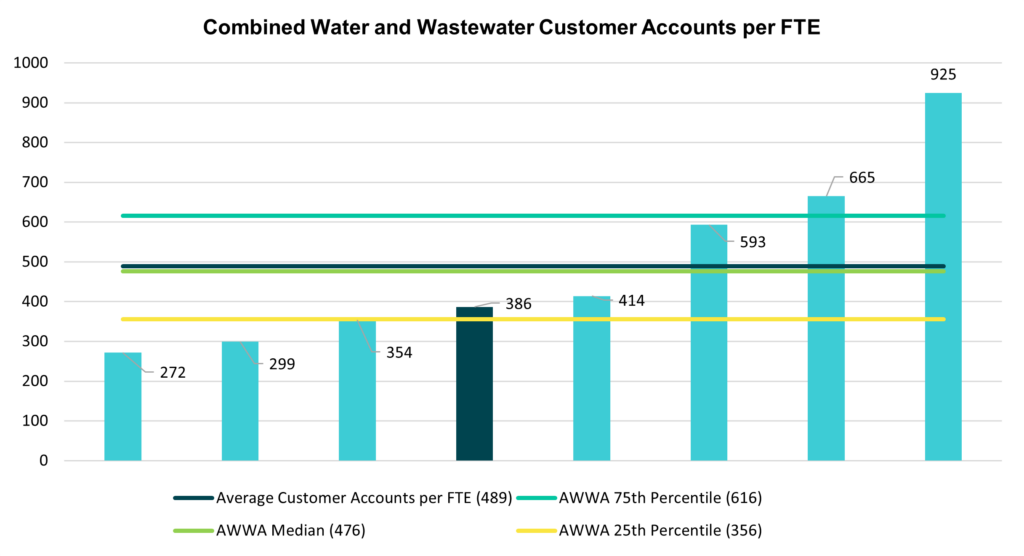
In the graph above, we see that most agencies in the region serve 300-400 customer accounts per FTE. The client utility, represented by the darker blue bar, serves 386 customer accounts per FTE, which is representative of its peers. Yes, its staffing is near the AWWA 25th percentile, indicating that three out of four utilities industry-wide have lower staffing rates, but from working with the client, we would have an understanding of why that might be. For instance, the client and its peers might serve rural areas that require greater travel time or have multiple treatment plants spread across their service areas. Often, a primary purpose of benchmarking is to identify whether the agency is an “outlier” in a particular metric, meaning they differ considerably – either higher or lower – than peers. For example, the utility on the far right of the graph serves 925 customer accounts per FTE, which is well beyond its peers and well outside of the 75th percentile reported by AWWA. On the one hand, an uninformed observer could surmise that this utility is highly efficient and thus needs lower staffing levels than its peers. From our perspective, we would want to investigate why this utility is so far outside what is observed in the industry and among its peers. We would inquire as to what their service levels are and whether they can be met given current staffing.
If, for another example, the Planning Department in Main Street USA has far more applications per planning staff FTE than other similar agencies, this says something about either staffing levels and/or workload volume (number of application submittals). If Gotham Police Department has far fewer arrests on average per officer than its peer agencies, this may also say something about workload and performance. But what?
In short, benchmarking provides insight on how one compares to others in the industry but is far more valuable when one goes beyond just the quantitative metrics. If a client is an outlier in one category, we should not rush to judgment on its performance being “good” or “bad,” or use the benchmarking as a ranking system, but ask the natural question that follows: “Why?” In any benchmarking exercise, knowing the “whys” can bring actionable value to the exercise.
When benchmarking peer organizations, it’s important not to compare apples and oranges. Yes, it’s true that no two agencies are identical. Even in close geographic proximity, one agency might have a different governing structure, different responsibilities, and differing operations. Each will have its own unique labor and financial constraints. A public works department in northern Minnesota will most certainly have a very different operation than one in the Arizona desert.
Rather than comparing apples to oranges, benchmarking done right selects apple peers for an apple client – but also acknowledges that more often than not we’re comparing Fujis to Galas (and we only include Granny Smith peers as a last resort). While each agency provides the same general services (development permit processing, policing, or public works, for example), each will have its own differences in environment, staffing, contracted services, etc.
Even acknowledging that there are always differences between even the most similar organizations, because we are looking at outliers and trends, benchmarking provides useful information. If, for example, one utility agency has a much lower FTE count per 100 miles of pipe, understanding the differences between organizations informs what we can learn from the metric. One explanation may be that one organization outsources a large portion of the work to contract vendors, pushing costs from salaries to professional services. Or it could be that they are highly efficient, with highly skilled staff, who are doing an excellent job maintaining the agency’s assets. Knowing this information ensures that the context is understood and brings true meaning to the benchmarking results.
Benchmarking is valuable to have in your organizational improvement toolbox as a means to explore your agency’s performance, and we often use it to provide additional information as part of a broader organizational assessment. Caution must be used, however, to ensure that any benchmarking effort goes beyond just the numerical metrics, especially if the results might drive decision making. Answering the “why” of metrics, and not just the “how much” enables benchmarking to be a powerful tool that can aid your organization in making data-informed decisions to improve operations.