minute read

Authors: Luke Eastman (Raftelis), Erika Smull (Duke University), Lauren Patterson, PhD (Duke University), and Martin Doyle, PhD (Duke University)Raftelis has partnered with researchers at Duke University to track the effects of COVID-19 on water utility consumption and revenues. This is an ongoing study: these are preliminary results from ten water utilities. Check back for updates as we receive more data from utilities and continue our analysis of this important topic.
Data through August 2020 for the ten water utilities in our study predominantly show total billed revenues through the late summer that are higher than previous years, despite continued lower non-residential consumption and revenues. Residential consumption remains a critical factor for utility revenues.
Our research team has now received water consumption and billed revenues data from ten water utilities across the country through August 2020, providing insight into how utilities have fared 5 months into the World Health Organization’s declaration of a global pandemic in March.In addition to two months of additional data since our last research update (found here on Raftelis’ website), we have added data from West Palm Beach (FL) and the Lehigh County Authority (PA). Lehigh County bills most customers quarterly, which creates a delay between potential COVID-19 impacts and subsequent changes in consumption and revenue. We show Lehigh County quarterly data in this post in alignment with the ending month of each quarter.
Figure 1 shows 2020 monthly water consumption compared to the three-year average (2017-2019) for that month. The early months of the pandemic saw overall decreases (shown in red) in total water consumption for most utilities, but consumption rebounded in July and August, with some utilities such as Trabuco Canyon and Marana experiencing very strong increases.
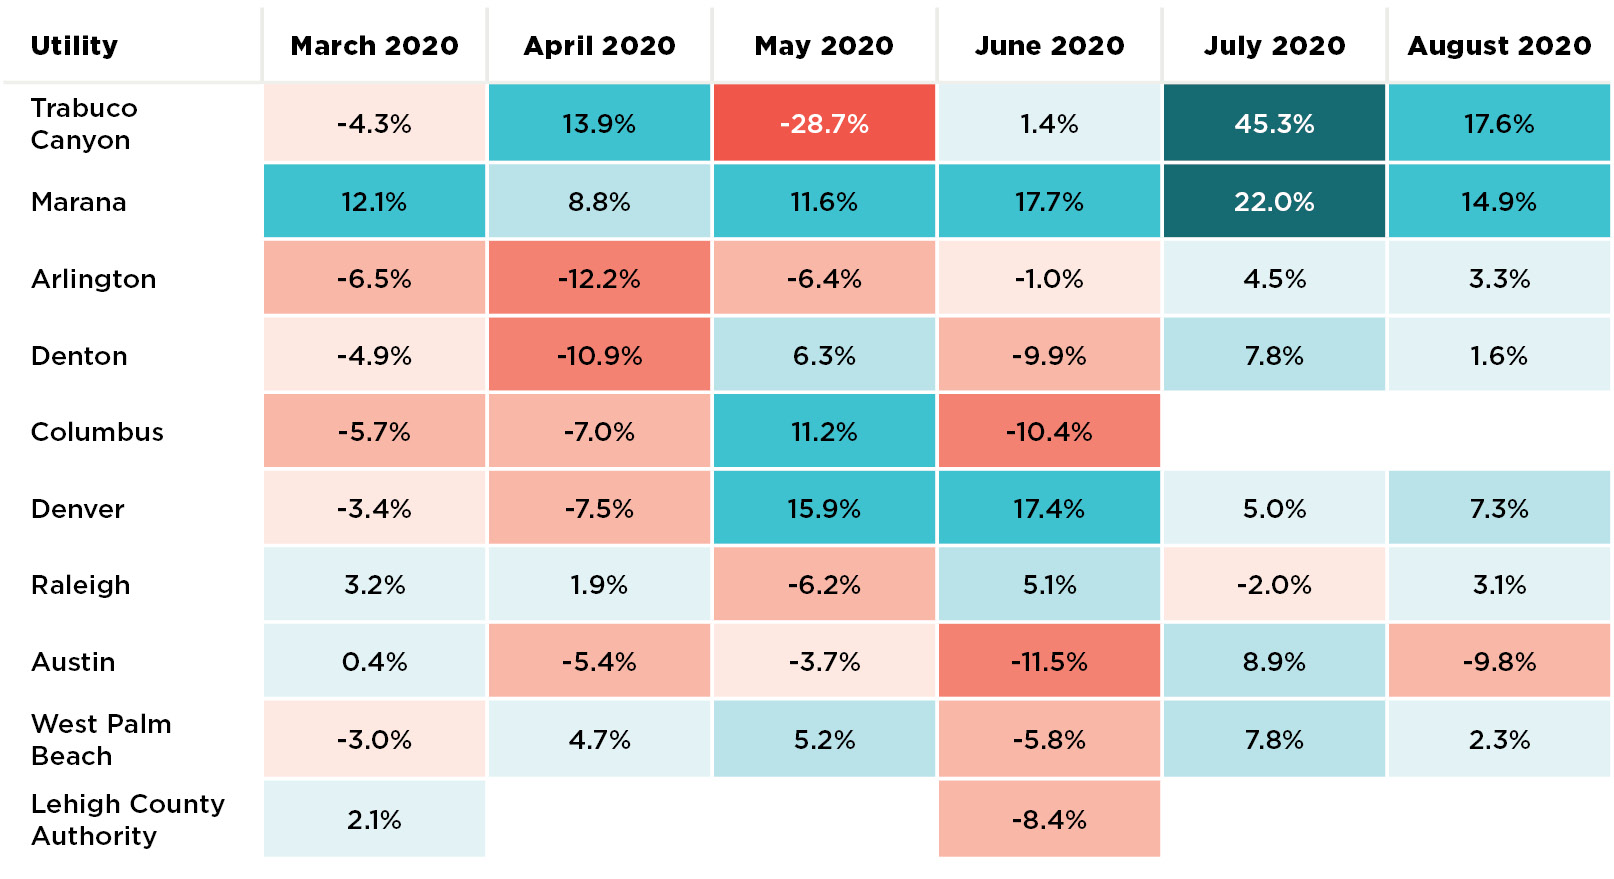
Figure 1. Percent difference in total water consumption between 2020 (COVID-affected) months and the three-year historical average for that month. Note that Columbus data from July and August did not arrive in time for this publication, and Lehigh County Authority bills customers on a quarterly basis, thus results are shown here for the quarter’s ending month.
Continuing the trend we observed in our last post, water consumption has been strong for residential customers and remains weak for non-residential customers. Figure 2 shows water consumption for 2020 through August in comparison with the past three years, by utility and customer class. Non-residential consumption was lower in Denver, Arlington (TX), Denton (TX), Austin (TX) and Lehigh County (PA), but residential consumption was higher in those same communities, as well as in Trabuco Canyon (CA), Marana (AZ), Raleigh (NC), and West Palm Beach (FL). Restrictions on commercial activity due to COVID-19 health orders and individual apprehensions surrounding COVID-19 likely continue to drive the reductions in non-residential consumption. Conversely, residential consumption is likely still bolstered by remote working as well as the hot, dry conditions that occurred throughout the United States, boosting residential irrigation and outdoor water recreation. Western communities such as Trabuco Canyon (CA), Marana (AZ), Denver (CO), and utilities in Texas saw especially dry conditions and a corresponding increase in residential water consumption.
<a href='#'><img alt=' ' src='https://public.tableau.com/static/images/20/2020WaterUtilityConsumptionComparedto2017-2019/ConsYearPlotDash/1_rss.png' style='border: none' /></a>
Figure 2.Monthly consumption for each of the utilities in the study during 2020 (blue line) versus 2017 to 2019 (gray lines). Select one of the utilities and the customer class of interest. Note: the latest data from Columbus (GA) was not available at the time of publication and data from Lehigh County Authority is quarterly so is not displayed here.
Despite the challenges of the pandemic for business operations, some water utilities in our study experienced a confluence of factors that may have led to higher-than-expected revenues. Overall, many utilities in this study saw greater monthly revenues during the summer of 2020 than the three-year historical average, as shown in Figure 3. However, utilities that altered rate structures (Raleigh) to lessen impact on customers due to the pandemic and/or chose to not institute a rate increase (Austin) months before the pandemic have generally experienced lower total billed revenues so far in 2020.
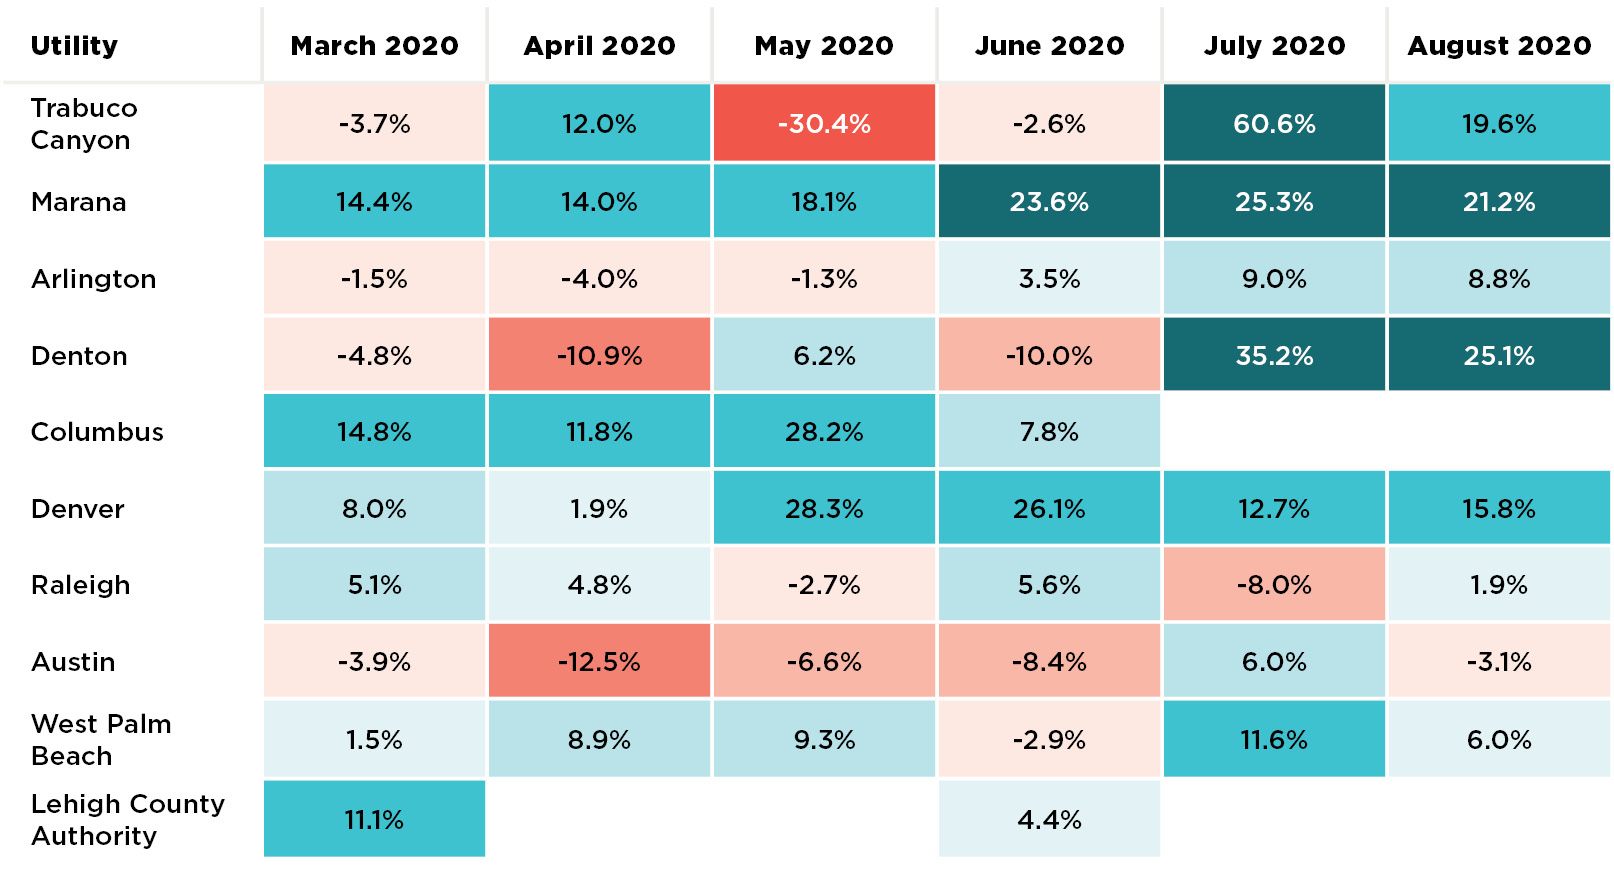
Figure 3. Percent difference in total billed revenues between 2020 (COVID-affected) months and the three-year historical average for that month. Note that Columbus data from July and August did not arrive in time for this publication, and Lehigh County Authority bills customers on a quarterly basis, thus results are shown here for the quarter’s ending month.
It is important to note that we did not conduct an analysis of individual customer use. However, if individual residential use increased along with overall residential consumption as we have observed, that use was likely charged at a premium due to inclining block tiered rates in place in Trabuco Canyon (CA), Marana (AZ), Denver (CO), Raleigh (NC), West Palm Beach (FL), Austin (TX), and Denton (TX), providing a revenue boost for these utilities. Figure 4 shows the increase in residential revenues in these places (red lines), compared to previous years (gray lines).
<a href='#'><img alt=' ' src='https://public.tableau.com/static/images/20/2020WaterUtilityRevenuesComparedto2017-2019/RevYearPlotDash/1_rss.png' style='border: none' /></a>
Figure 4. Monthly billed revenues for each of the utilities in the study during 2020 (red line) versus 2017 to 2019 (gray lines). Select one of the utilities and the customer class of interest. Note: the latest data from Columbus (GA) was not available at the time of publication, and data from Lehigh County Authority is quarterly so is not displayed here.
Data from ten water utilities through August 2020 show that non-residential water consumption continues to be weak since the pandemic declaration in March. Residential consumption, however, has been high, especially during the summer and for utilities serving Western U.S. communities, which experienced hot, dry conditions that likely contributed to greater residential water use. This use in turn likely increased residential billed revenues for those utilities that had inclining block rate structures, leaving the majority of the utilities in our study with greater overall revenues in July and August 2020 than the historical average from 2017 to 2019.

Link copied