Authors:
Luke Eastman (Raftelis), Erika Smull (Duke University), Lauren Patterson, PhD (Duke University), and Martin Doyle, PhD (Duke University)
Raftelis has partnered with researchers at Duke University to track the effects of COVID-19 on water utility consumption and revenues. This is an ongoing study: these are preliminary results from five water utilities. Check back for updates as we receive more data from utilities and continue our analysis of this important topic.
Preliminary data from five water utilities of different sizes and different climates across the U.S. show variable impacts to consumption and billed revenue in response to the global pandemic. Some utilities saw a decline in primarily non-residential consumption of up to 19% and non-residential billed revenue of up to 8% in April, one full month into the pandemic, relative to April usage and revenue in the past three years. For some utilities, consumption and revenues remained similar to previous years. In general, that is good news – from these preliminary data, COVID-19 does not appear to be causing a ground shift in all water utility consumption and revenues. In general, residential customers are using water in similar amounts to previous years, and often more – one utility saw an increase in residential consumption of 14% in April 2020 compared to the average of the past three years. Annual rate increases and steady or increasing residential consumption results in billed revenue that appears to offset effects of the COVID-19 shutdowns. Importantly, our data reflect billed revenue, not actual revenue; delinquency or nonpayment rates remain a significant source of uncertainty for water utilities.
Our research team received data for water consumption and billed revenues from five water utilities (Columbus Water Works, GA; Denver Water, CO; the City of Raleigh, NC; Trabuco Canyon Water District, CA; and Marana Water, AZ) spanning from January 2017 through April 2020. For the study, we targeted utilities with billing practices that would give us enough detail regarding the impacts of COVID-19 on water consumption and revenues. Specifically, we looked for utilities that bill customers monthly, have defined customer classes (e.g. residential, commercial, industrial), and have a historic record of at least three calendar years, to best differentiate a “baseline” amount of consumption and revenues prior to COVID-19.

Trabuco Canyon Water District (TCWD) serves a population of approximately 13,000 people south of Los Angeles. TCWD assesses a monthly charge that increases with a customer’s meter size. Single-family residential customers are assessed a four-tier inclining volumetric rate, while non-single family customers are assessed a uniform rate according to their class: agriculture, multi-family, commercial, construction, and irrigation. TCWD has implemented moderate rate increases in 2018, 2019, and 2020.

The Town of Marana is a fast-growing community of approximately 50,000 people located northwest of Tucson, Arizona. The utility operates in a hot, semi-arid climate, where water is a treasured resource. The utility assesses its residential customers a moderate monthly fixed charge and a steeply inclining five-tier volumetric rate, which incentivizes water conservation. Non-residential customers are charged a uniform volumetric rate in addition to a monthly fixed charge according to meter size. All customers are assessed a “groundwater resources fee” per thousand gallons used to help recover the costs associated with acquiring groundwater. Marana implemented new cost-of-service rates in 2020, which had varied impacts on its customer base.
Columbus Water Works (CWW) provides water service to approximately 250,000 residents in the Columbus, Georgia region. It assesses water customers a monthly fee according to meter size, in addition to a two-tiered volumetric rate which slightly increases rates for non-industrial customers and slightly decreases rates for industrial customers with large water use. It has raised rates each year from 2017 to 2019, with a rate structure change in 2019 that increased revenues from fixed charges.

Denver Water serves approximately 1.5 million people in the city of Denver and its surrounding suburbs. Denver has a semi-arid climate with four distinct seasons, and receives most of its precipitation from April to August. Denver Water assesses both residential and non-residential customers a monthly fixed charge that increases with meter size, as well as a three-tier inclining volumetric rate structure. The utility has raised rates moderately each year from 2017 to 2020.

The City of Raleigh serves approximately 600,000 people in the city of Raleigh and significant populations in surrounding areas. Raleigh charges a monthly fixed charge that increases with meter size, plus an inclining tiered volumetric rate for residential water use. Non-residential water use is charged at a uniform volumetric rate. The City has raised water rates moderately each year from 2017 to 2020.
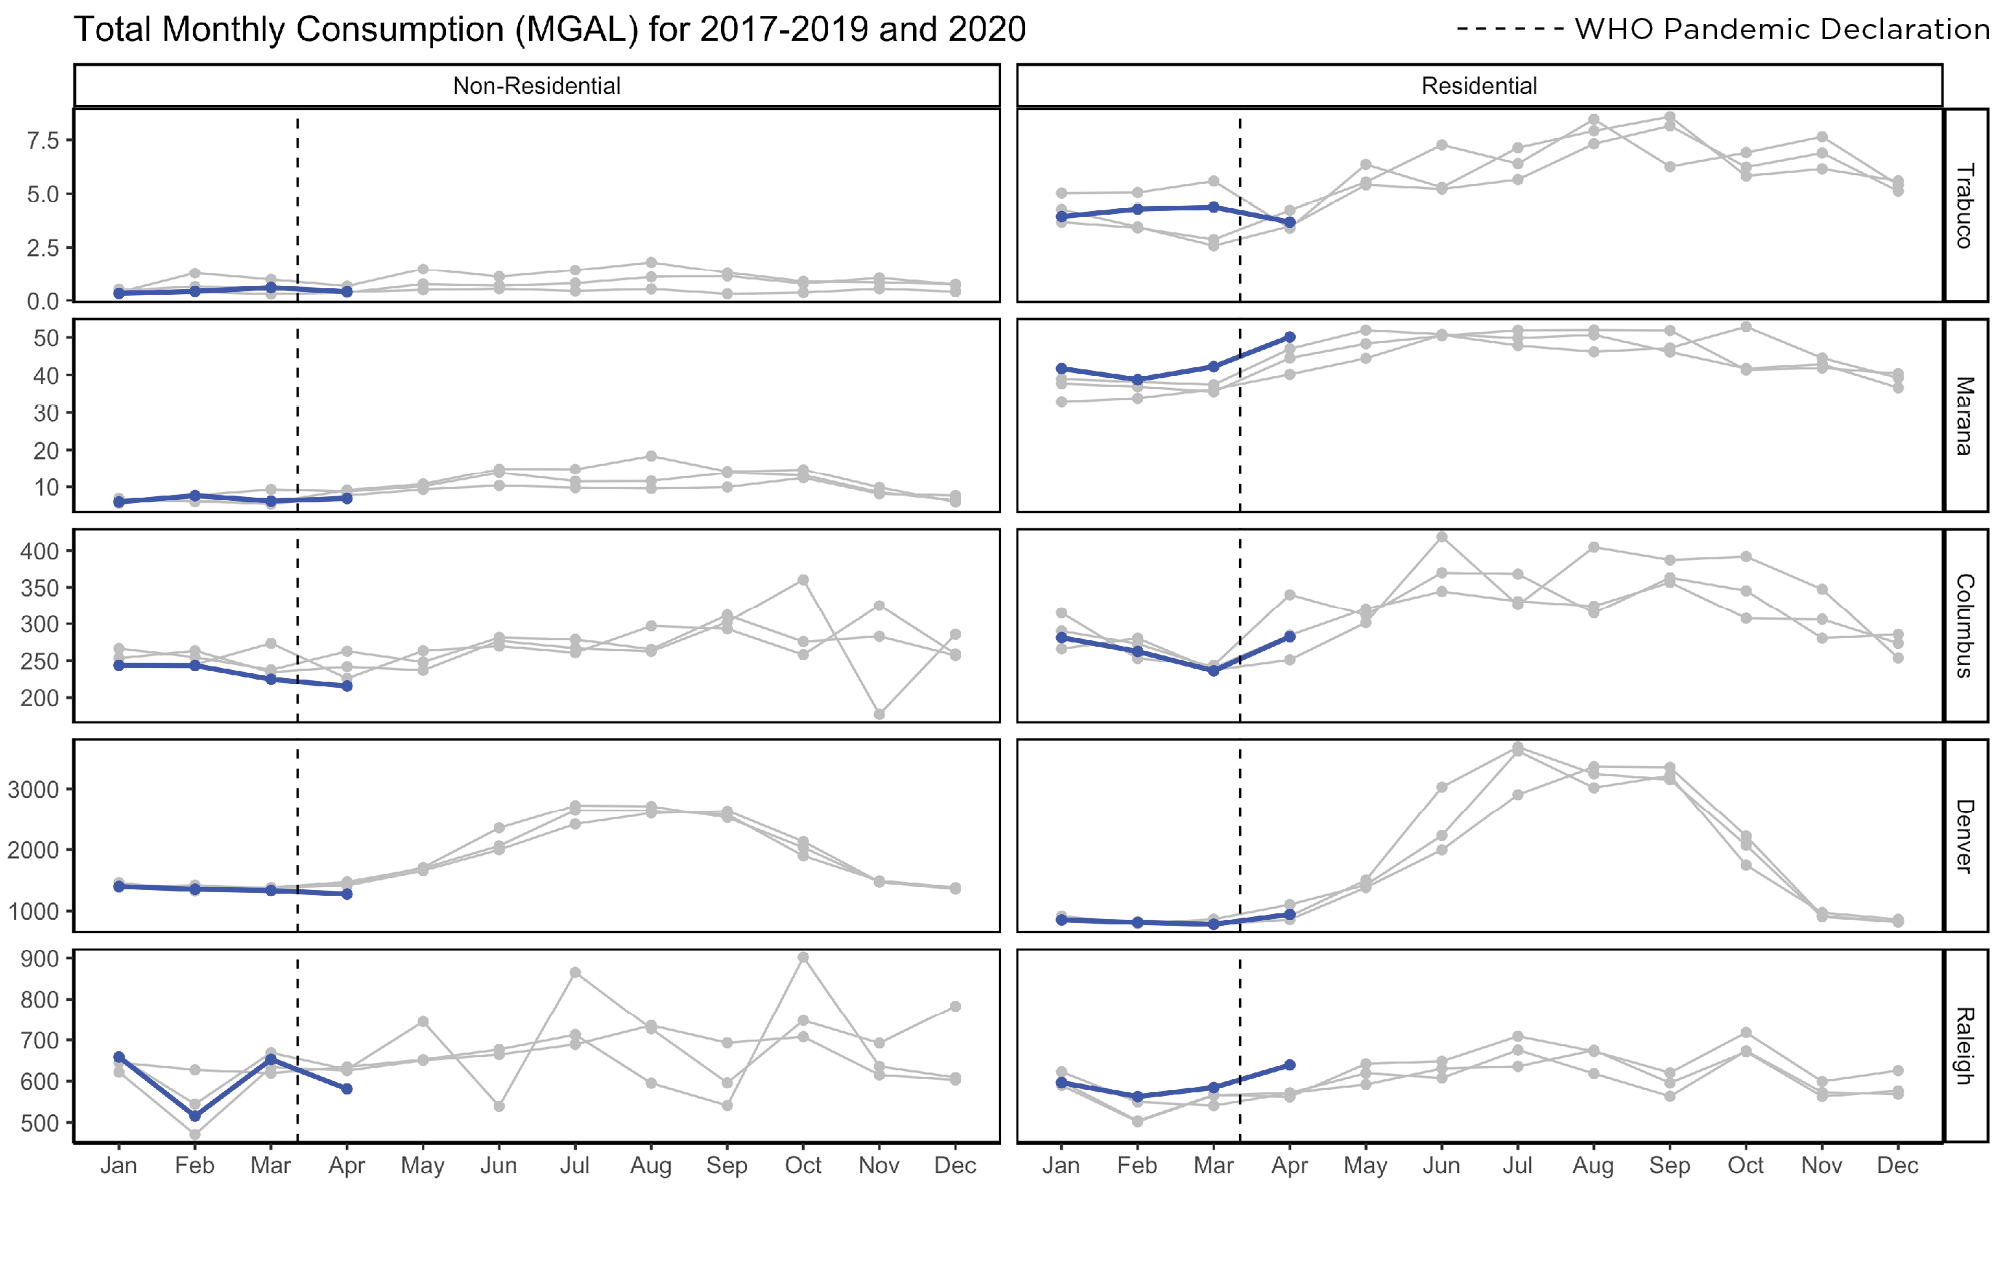
We analyzed 2017-2020 consumption data from each utility to look for changes in consumption starting in early 2020, following the pandemic declaration and shutdowns. Data were analyzed for non-residential and residential customer classes – greater differentiation between customer classes was not possible because of the diversity of classes between utilities. The “residential” group includes single-family residential customers, while “non-residential” includes multi-family housing, government, commercial and industrial customers. Irrigation, agricultural, and reclaimed water customers were excluded because not all utilities have those customer classes.
Two primary factors that influence consumption trends were considered in this analysis. First, seasonality influences the amount of water generally used each month. Residential customers in drier regions, such as TCWD, Marana, and Denver have seasonal consumption patterns with higher consumption in the irrigation season (summer and early fall). With the exception of Denver, non-residential consumption is less affected by seasonal patterns.
Second, the economic slowdown was anticipated to disproportionately impact non-residential usage as many commercial and industrial businesses closed or drastically reduced production. As a result, those utilities serving a larger non-residential base were expected to experience greater loss of consumption and potential revenue. For the utilities in our study, non-residential consumption in 2019 accounted for 12% of TWCD’s consumption, 20% of Marana’s consumption, 45% of CWW, and around 52% of Denver Water’s and the City of Raleigh’s consumption.
Figure 1 shows consumption results for five utilities, ordered from least to most reliance on non-residential use. Non-residential use decreased relative to previous years, most obviously for the two largest utilities with the greatest percentages of non-residential use (over 50%). For all utilities, residential consumption remained within the range of previous years or increased. For utilities that experience consistent seasonal consumption patterns (Denver, Trabuco, and Marana), changes in consumption in 2020 are more likely to fall outside of their intra- and inter-annual consumption variability. Marana Water experienced a decline in primarily non-residential consumption of 19% in April compared to the average of the past three Aprils. Marana Water also saw an increase in residential consumption of 14% in April 2020 compared to the average of the past three years. This could be due to the sensitivity of its small customer base.
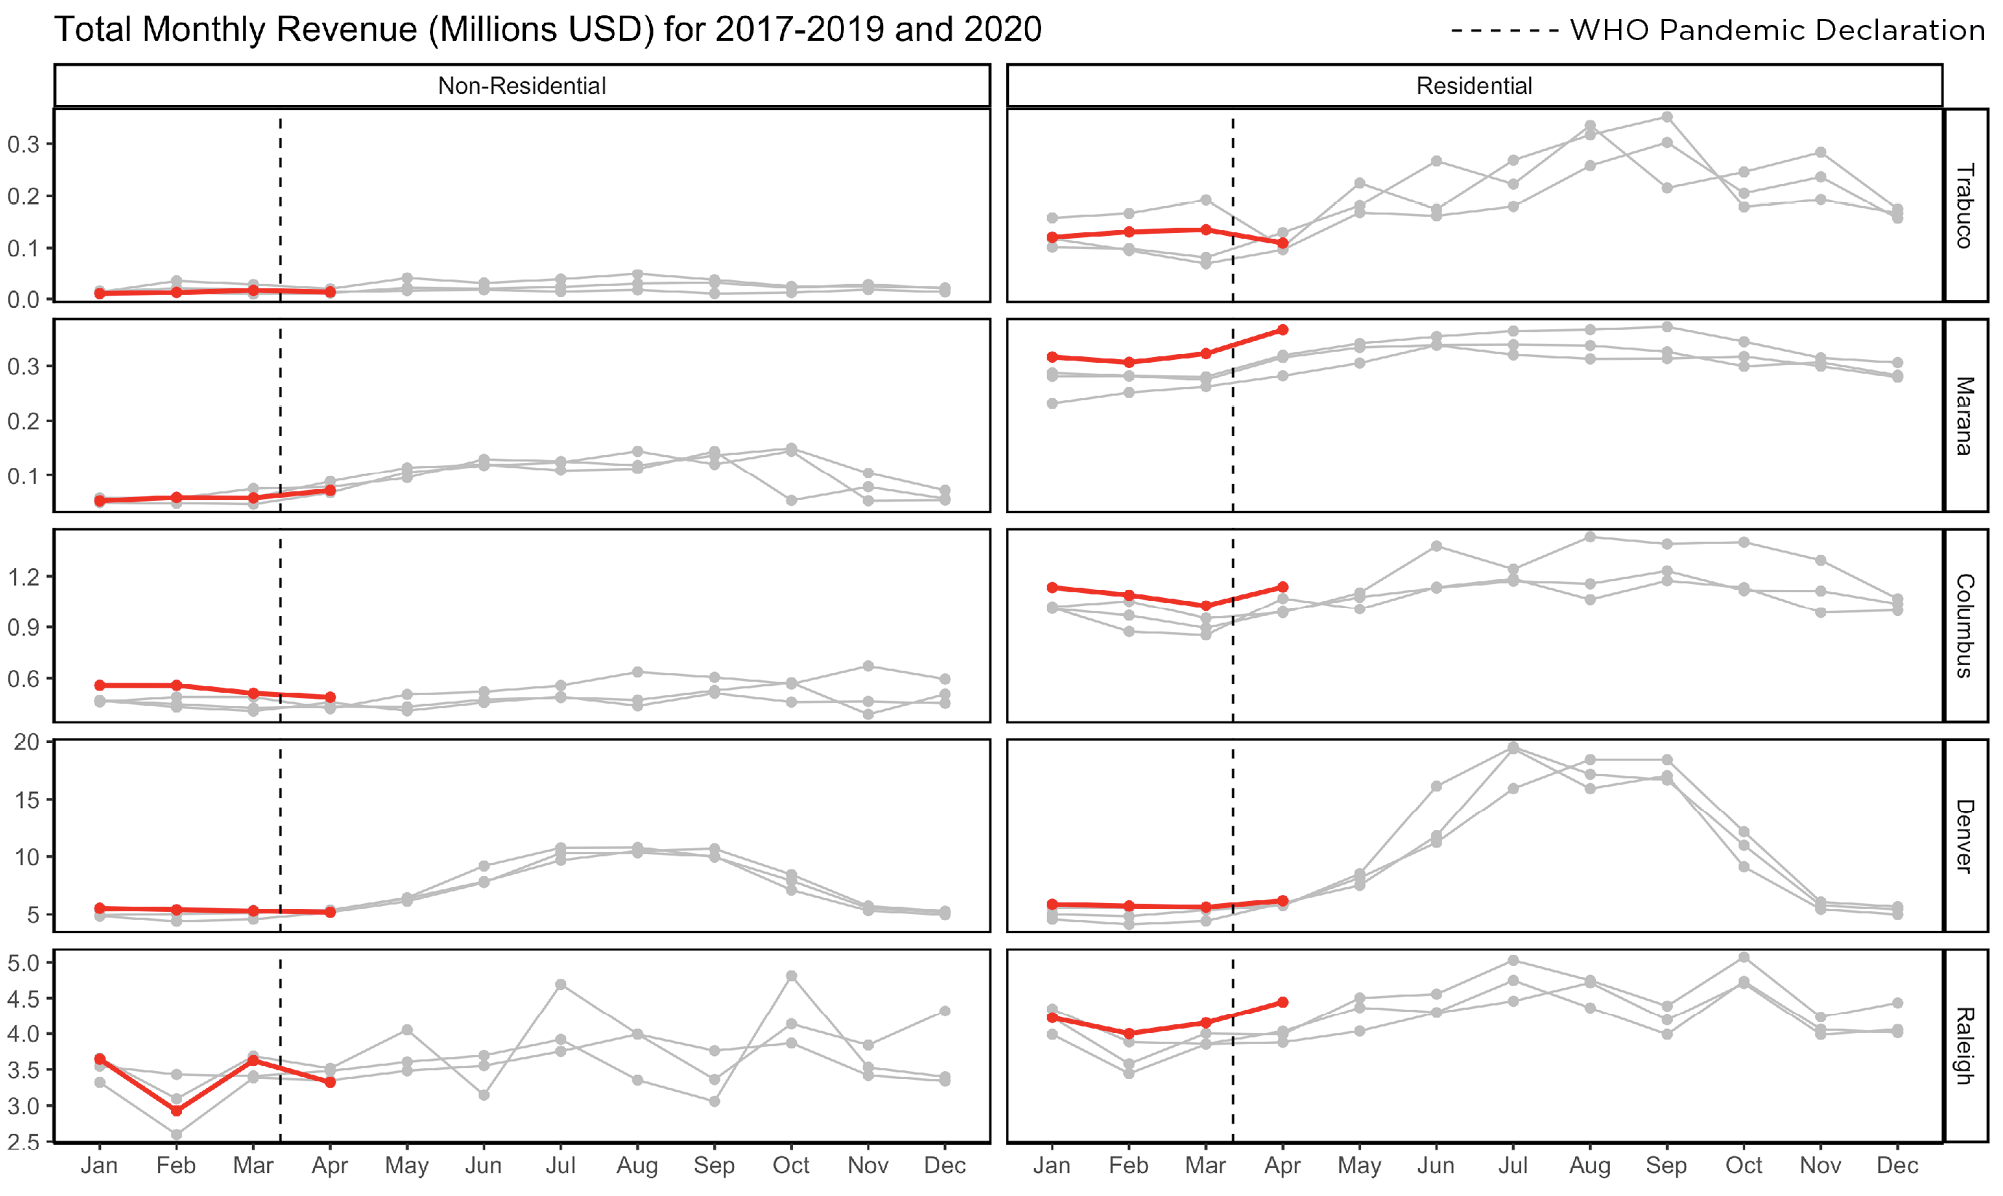
We also looked at non-residential and residential customer billing. This will likely be higher than actual revenues recovered because of anticipated higher delinquencies due to the negative economic effects of the COVID-19 shutdowns.
Billed revenues showed smaller impacts than expected thus far in the pandemic, despite the shutdowns. Most utilities in our study were increasing rates annually, and therefore billed revenue in 2020 compared to the previous three years is higher. Non-residential revenue is impacted in some locations but not uniformly, and residential billed revenue is either higher than or consistent with the 2017-2019 revenue (Figure 2). Marana Water saw the largest dip in non-residential revenues of 8% in April 2020.
Results so far show some expected and some unexpected changes in consumption and billed revenue. Residential consumption has held steady or increased in the five utilities examined in this study, while non-residential consumption has held steady or slightly decreased. Both residential and non-residential revenues appear to be resilient to changes in water consumption. Check back for updates as we expand this research and dig deeper into the effects of COVID-19 on water utilities.