
Authors: Rocky Craley, Senior Manager (Email) and Arisha Ashraf, Consultant (Email)
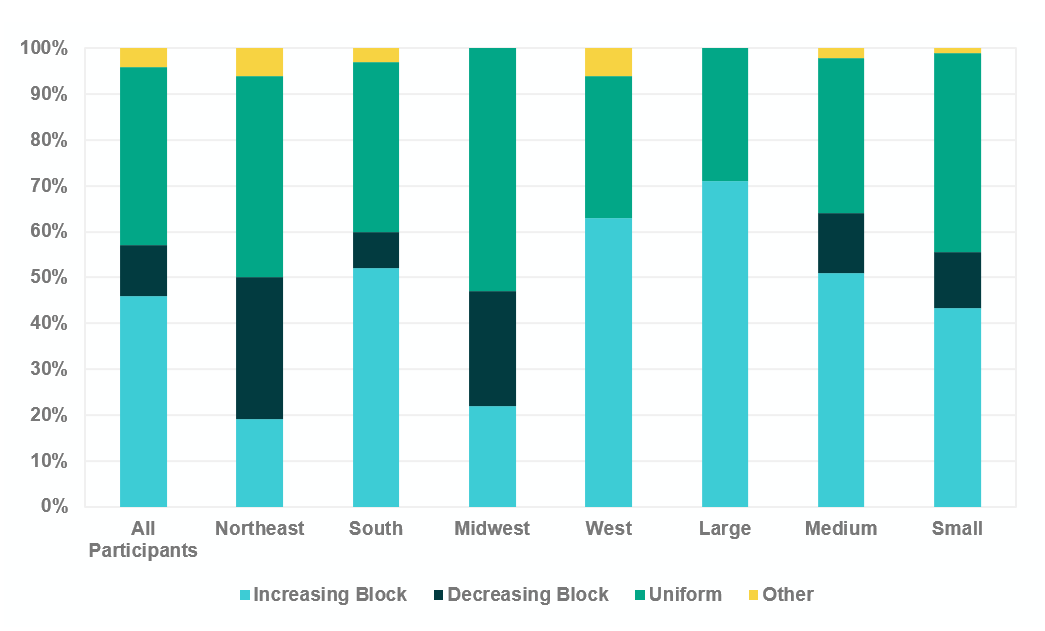
Increasing block rate structures is the favorite way utilities charge for water and yet when we dig deeper, it’s clearly most common in the South and West. This is most likely due to this rate structure’s ability to enhance water conservation and/or demand management, which is a prevalent need in these areas.
The Northeast and Midwest have a much-varied set of rate structures, with Uniform rate structure being the most common. Here, structures that promote conservation are less necessary since the northeast and Midwest water utilities typically have ample water supply.
Larger utilities also favor the increasing block structure and smaller utilities have a more varied approach. This may be because medium and larger utilities tend to have more sophisticated billing systems that support differentiation and smaller systems may prioritize simplicity for assessing water charges.
There is a lot less variation in how utilities charge for wastewater service. That’s because there is less direct connection between demand management and wastewater rates and charges, so a uniform rate structure is by far the most common rate structure.
Wastewater utilities are more frequently differentiating between customers and classes through high strength surcharges. These are additional charges above normal user rates, typically assessed on effluent from only a small subset of customers, such as industrial customers, that may have Biological Oxygen Demand (BOD), Suspended Solids (TSS), Nitrogen (TKN), or Phosphorus (P) above typical ranges.

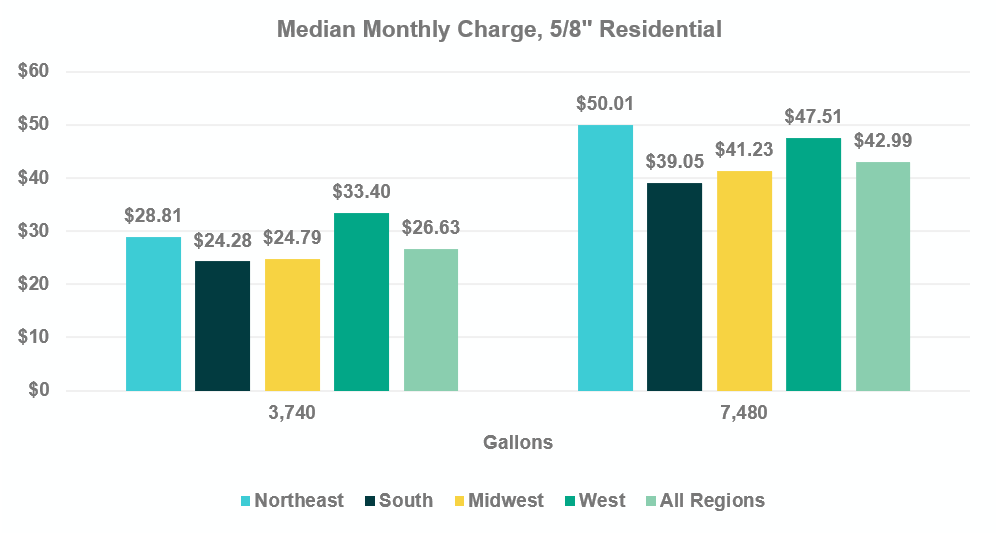
City councils and boards of directors always like to know how their utility’s rates compare to others, so a big part of the rate survey is showing what other utilities charge. Monthly water bills are higher in the Northeast and West than the Midwest and South at both 3,740 gallons per month (5 ccf) and 7,480 gallons per month (10 ccf).
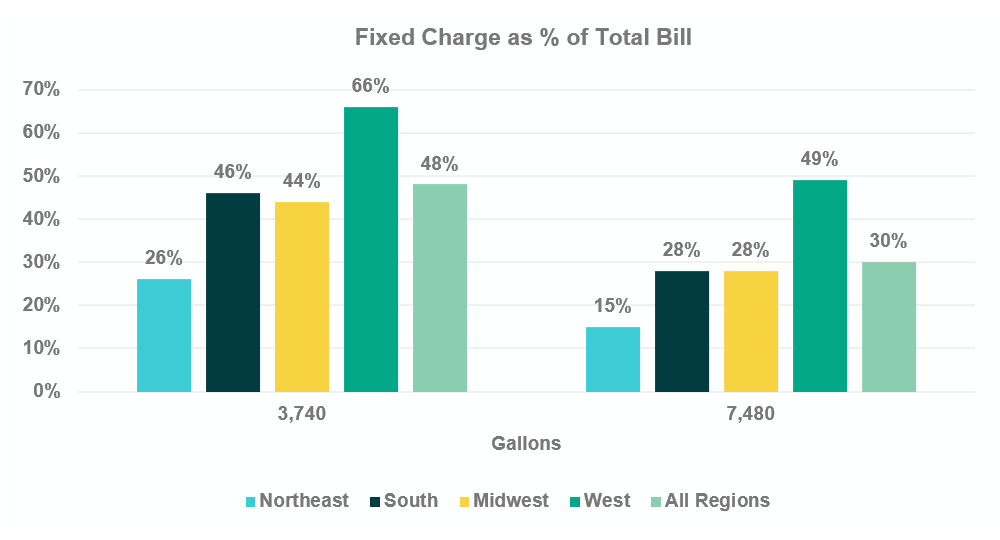
There’s an interesting footnote here. The fixed charge as a percent of bill analysis shows that utilities in the West have higher base charges, or fixed charges, relative to the volumetric charges of a bill. The West also has the highest percentage of utilities that use an increasing block structure. One of the concerns of using increasing block structures is revenue stability. This is because increasing block structures recover more revenue from higher volumes, which can be volatile one year to the next. One way to balance this is by recovering more revenue from a fixed charge component, which would support the results.
Monthly wastewater bills at 3,740 gallons per month (5 ccf) are very similar among regions, within 10%. But monthly wastewater bills vary quite a bit at the 7,480 gallons per month (10 ccf) usage level and are higher in the Northeast, followed by utilities in the Midwest and South.
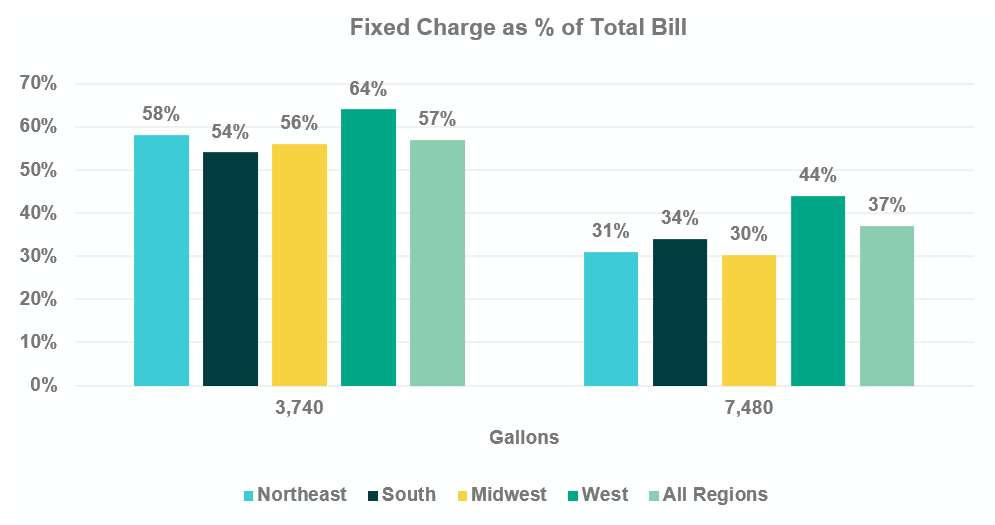
The fixed charge as a percent of bill analysis shows that utilities in the West have higher base charges, or fixed charges, relative to the volumetric charges of a bill. This is consistent with the results of the water charges analysis, but it’s even more interesting on the wastewater charge analysis since the West shows the lowest bill at 7,480 gallons (5 ccf) per month, but the highest fixed charge.