


Authors: Mihaela Coopersmith, Senior Consultant (Email), Ford Moriarty, Consultant (Email), Rocky Craley, Senior Manager (Email), Joe Crea, Vice President (Email), and Morgan Palmer, Intern
But is this just a moment in time, or have we crossed into territory where utility bills are a burden to a growing number of customers? We’re in a unique position to find out—together with the American Water Works Association we just completed work on a national survey on water and wastewater rates, and earlier this year we received new guidance from U.S. Environmental Protection Agency (EPA) about utility affordability.
Here’s what we know for certain. We’ve published the rate survey for 20 years, and in that time, customer bills have increased by more than 5% per year. That means that a combined water and wastewater bill in 2001 for 10 ccf/7,480 gallons that was $34 is now $97. Over that same period, median household income in the U.S. has increased just 2.5% per year, nearly keeping pace with inflation while low-income households have seen declines in some years. This creates an environment where affordability challenges will develop.
Earlier in 2021, the EPA published a draft document that outlines new affordability guidance for water and wastewater utilities. The updated guidance provides more flexibility for utilities to measure, evaluate, and determine if their rates and charges present potentially high burdens on their customers. The revised guidance also recognizes that affordability should be evaluated specifically for low-income households—not median or average income households. Specifically, the EPA divided household income into fifth and focused on the 20% of households with the lowest income—the lowest quintile.
If you’ve been following the affordability discussion in our industry you know that there are several ways to factor affordability, but the EPA’s draft guidance retains a focus on the previous EPA guidance that suggested that a customer bill for sewer service that is greater than 2% of income is considered “High Burden.” This threshold is generally adjusted to 4.5% when including water service as well. The cost of a water and wastewater bill at typical usage as a percentage of the lowest quintile’s household income is called a Residential Indicator.
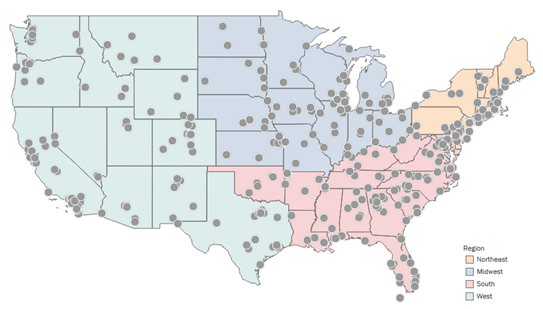
The data collected as part of the AWWA/Raftelis rate survey, and other rate and charges information for utilities throughout the country provides a powerful dataset to explore the affordability of water and wastewater service. The following map shows utilities that have been included in this evaluation of customer bills and affordability and breaks them into the regional groups used in the rate survey. (Utilities in Hawaii and Alaska were included in the analysis but not shown in this image)
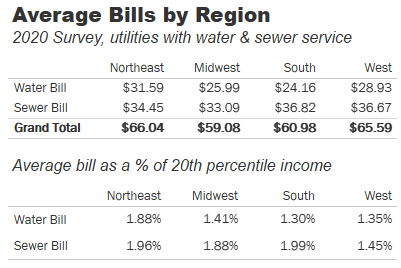
Residential rates and charge data for each utility was used to develop a combined water and sewer customer bill for 5 hundred cubic feet (ccf) or 3,740 gallons of monthly water use (a typical monthly bill in many parts of the country).
The average regional bills are presented in the following table. Overall, residential service costs are consistent across the country. However, the variations between individual utilities can be significant given unique local factors.

Data on household income is obviously a key factor in an affordability evaluation. We have compiled household income data from the 2019 American Community Survey for each location in our survey. We then compared the actual 5 ccf/3,740 gallon bills for each utility to household income at the 20th percentile (lowest quintile) to create the residential indicator.
The following table shows the average residential indicators for each region of the country.
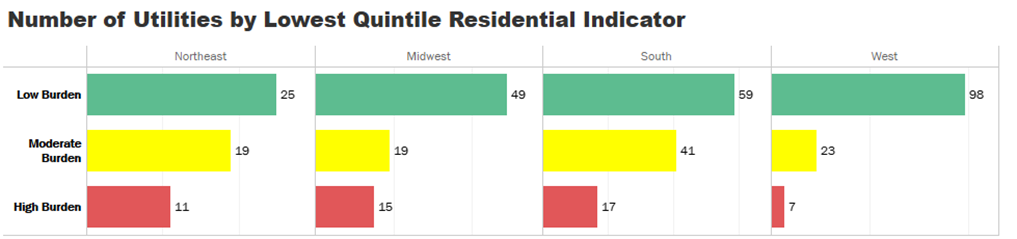
Within each region we can also see a distribution of utilities whose actual utility bills are measured as either Low Burden (less than 3%), Moderate Burden (between 3% and 4.5%), or High Burden (greater than 4.5%).
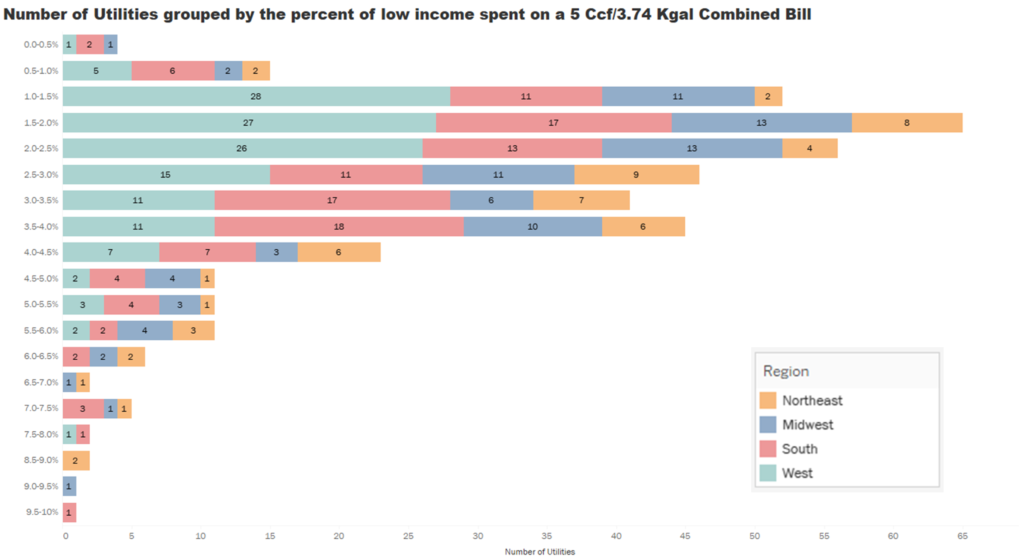
Exploring the residential indicators based on where they fall within these broad categories is shown in the following histogram. We can see that approximately 75% of the surveyed utilities have a combined bill that represents between 1.0% and 4.0% of income at the 20th percentile. Given the historical trend of rate increases around 5% per year for water and sewer service, national affordability challenges will continue to be a critical part of utility management.
The data confirms that many households throughout the country struggle to pay for water and sewer service. We will continue to examine this data and look forward to sharing more insights with the water community.
One of the best things about the water industry is that our colleagues are natural problem-solvers, and they understand the value of the service they provide to the community that relies on them. Often the solution to an affordability challenge is multi-faceted—it’s thinking about both short-term and long-term assistance programs and even looking inside the organization to ensure that the cost to serve the community is as low as good service levels allow. If you are thinking of taking a journey toward reducing the burden of water bills for those within your lowest quintile of household income the following articles and guidelines may help.
Note: This analysis presents a very narrow slice of customer affordability and the information presented in this tool is not definitive, nor does it indicate real or perceived burdens for water service. Raftelis strongly recommends each utility explore how their water and sewer charges effect customers and develop strategies to provide assistance to households that may require it.